
Today we're releasing Klang Dialects: an open dataset and benchmark for Swedish speech recognition.
Local Swedish dialects are underrepresented in widely used benchmarks. Klang Dialects brings together 1,804 recordings crowdsourced from across Sweden, a step towards speech recognition that works well for everyone.
We launched Knäck Klang as a challenge: read three sentences and see how well Klang understood you. The worse our transcription, the more points you earned. It was gamification with a clear goal: to create a public dataset with voices and dialects from all over Sweden.
This post details the first version of our Klang Dialects benchmark dataset: a free and publicly available dataset in Swedish, containing over 1,800 recordings and more than five hours of speech.
An invitation to be difficult
Much of our early research at Klang focused on Swedish speech recognition. We know from that work how much a dialect can affect performance. To improve performance across dialects, we first need to measure those differences.
However, datasets covering Swedish dialects are limited, and few include regional or dialect information. This is why we launched Knäck Klang. To ask participants, not to speak clearly, but to use their real dialect and see if it is difficult to transcribe. We recruited mainly through social media and presented it as both a challenge and a way to contribute to an open speech dataset.
Participants received three different sentences to read, randomly selected from multiple difficulty levels. In total there were 111 different prompts to read from. The sentences ranged from everyday language to tongue-twisters. Participants then saw a comparison of our transcript with the prompt, together with their final score. At this stage they could also supply a postcode, whose first three digits give us the approximate geographic coverage shown below.
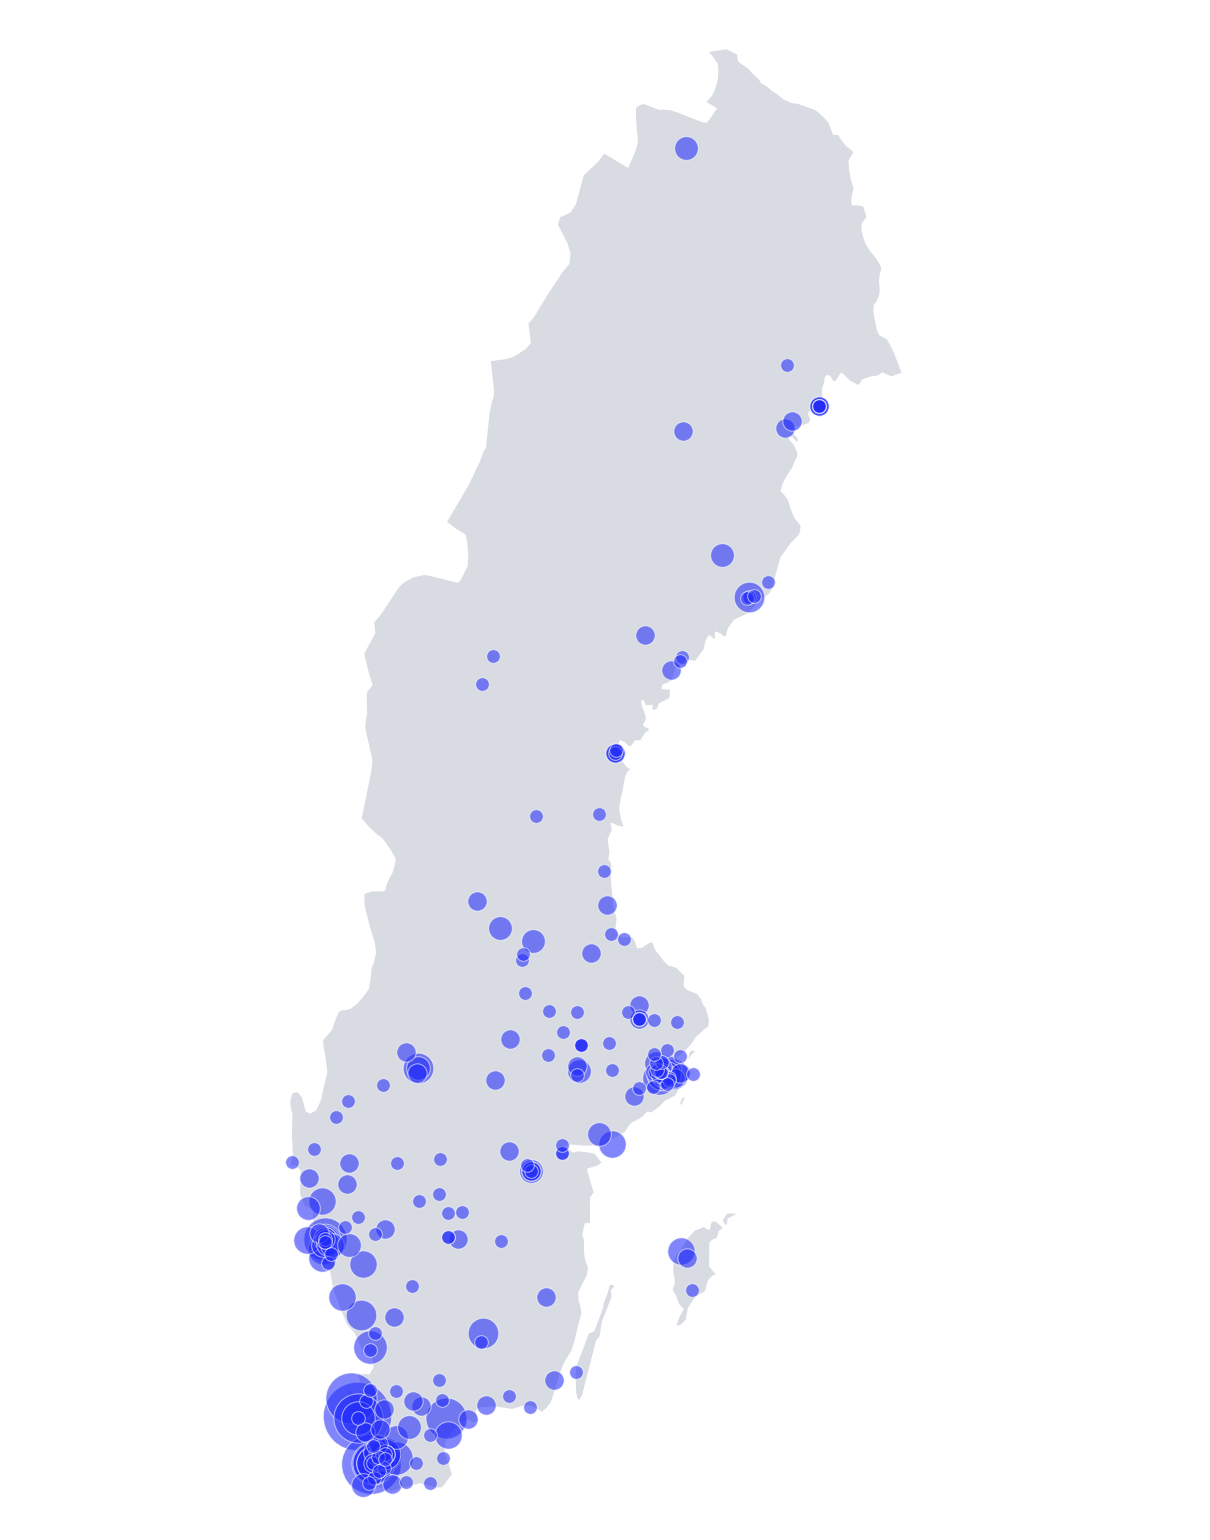
- contributors
- 671
- shown on map
- 547
- without postcode
- 124
postcode prefix
Participation was strongest in southern Sweden. This likely reflects both Sweden's population distribution and the reach of our own social networks. It still gives us valuable information, but also illustrates that we need to focus even more on trying to spread the challenge even wider.
What did people actually say?
One of the most interesting findings concerned the reading task itself: how often participants made mistakes when reading a prompt aloud. When comparing the transcripts to the prompts, we found a lot of unexpected differences like the following:
| Sentence on screen | Reviewed transcript |
|---|---|
| Jag glömde köpa mjölk kan du svänga förbi butiken? | Jag glömde köpa mjölk kan du svänga förbi affären? |
| Vi såg en riktigt bra film på bio förra veckan. | Vi såg en riktigt bra film förra veckan. |
When listening to the clips, it was clear that the transcript actually matched the audio. In the first example, the participant used a different word for "shop", and in the second, they left out "på bio", meaning "at the cinema" completely. It turns out that it's quite common to misread or misspeak when reading from a prompt. It would therefore be incorrect to simply use the original prompts as ground truth in the dataset. The standard way to measure transcription error is using WER (Word Error Rate), which counts the number of substitutions, deletions, and insertions needed to go from one to the other, relative to the number of words in the sentence. In the second sentence, that means 2 deletions out of 10 words, i.e. 20%, which would skew any measurement significantly.
Building a benchmark from the challenge
We therefore had to verify and adjust the reference texts to be able to publish a reliable benchmark set. The audio was first transcribed with several different speech recognition models, and examples where all the models agreed with the original prompt were automatically accepted.
The research team at Klang then manually reviewed roughly 1,000 recordings, and adjusted the reference text to correspond to the audio.
In the resulting benchmark, 203 recordings have adjusted references compared to their assigned prompt.
We provide two configurations for the benchmark set:
sv-clean1,804 recordings with high-quality references for WER comparisons.sv-rawincludes every recording fromsv-cleanplus 79 recordings where it was unclear what the "correct" transcript should actually be.
The second set contains cases where the participant severely mispronounces words, restarts a sentence midway, or makes similar errors where it's not clear what the correct transcript should be. We kept these examples since they often represent difficult problems for ASR models. But at the same time, we did not want to include them in sv-clean, because a difference in output compared to the reference text should not necessarily be counted as an "error". Even a "perfect" recognizer could score above 0% WER on this set.
What the model evaluation revealed
We evaluated an unreleased internal Klang model on sv-clean. It measured 4.8% word error rate and 1.7% character error rate after normalizing capitalization and punctuation. On 70% of the recordings, or 1,275 of 1,804, the transcription matched the reference exactly.
We could also clearly see that error rates increased with prompt difficulty as shown in the following table.
| Prompt level | Recordings | Word error rate | Character error rate |
|---|---|---|---|
| 1 | 608 | 3.36% | 1.25% |
| 2 | 614 | 4.71% | 1.86% |
| 3 | 582 | 6.18% | 1.86% |
Written form and recognition errors
Normalization is important to get fair estimates of error rates. The model above scores 6.94% WER on the raw text, compared with 4.80% after normalizing the text. This removes differences such as sentence capitalization and punctuation placement, which often have multiple valid forms, from the word recognition score.
However, Swedish also allows variation in how some expressions are written. For example, both imorgon and i morgon are accepted variants according to Språkrådet. Our references use one spelling, so a valid alternative can still produce a high word error rate.
Character error rate, or CER, instead measures edits to individual characters. It helps distinguish a small spelling difference from a larger change in the text as illustrated in these examples from the dataset.
| Reference transcript | Model output | WER | CER |
|---|---|---|---|
| Vi ses vid stationen klockan tre i morgon. | 28.6% | 2.5% | |
| Kvällstidningens krön i kör kritiserade kommunens krångliga bygglovsprocess i sin krönika. | 33.3% | 2.3% | |
| Projektledaren föreslog ett uppföljningsmöte efter samma semestern. | 33.3% | 3.0% |
All three outputs are close to the reference at the character level. But they range from an accepted spelling variant to completely incorrect sentences. Neither measurement is perfect, but both provide valuable insights.
How recognition varies across Sweden
Since we asked users to provide a postcode, we had a unique ability to see how speech models handle different dialects. This turned out to be one of the most interesting results from the dataset.
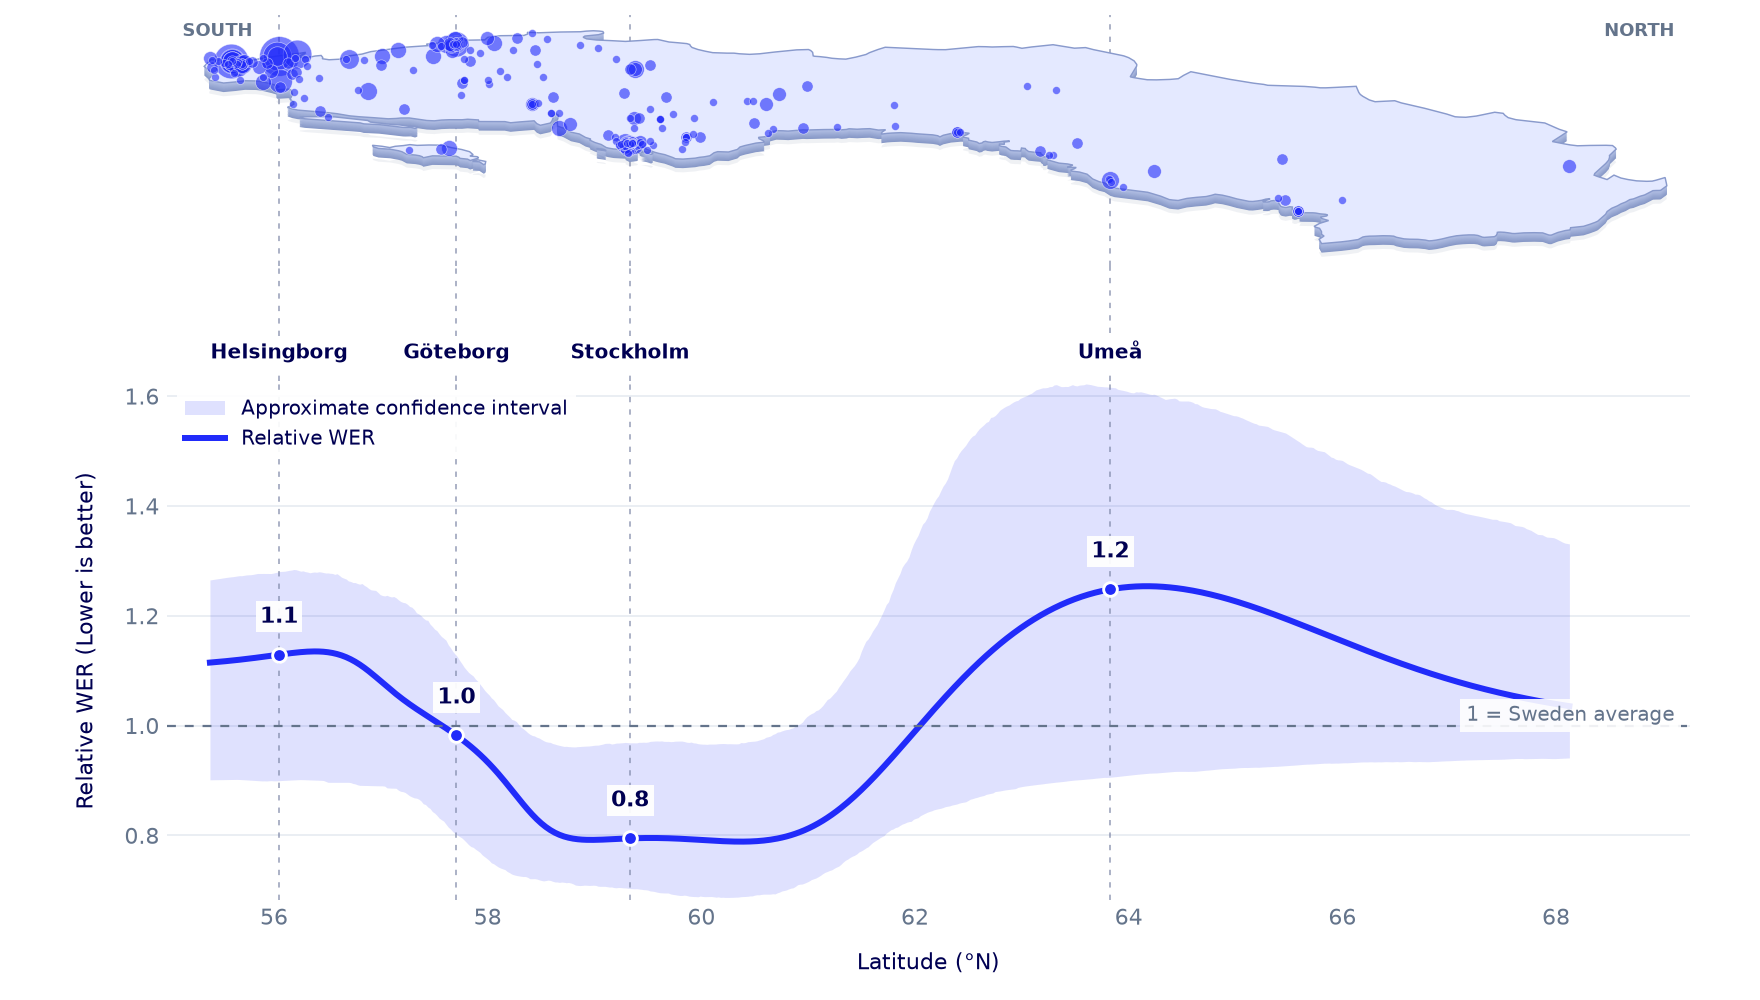
We compared the output of 13 different open source speech recognition models on the almost 1500 recordings in sv-clean that contained postcode locations. For each model, we divided the WER on each recording by the model's overall WER, then averaged the normalized scores across models. A value of 1 therefore represents the average error rate over Sweden.
The lowest relative error rates occur around Stockholm's latitude, with higher rates in Skåne and Norrland. It is perhaps unsurprising that speech from around Stockholm appears easier for these systems to transcribe than dialects farther south or north. This is probably a result of a combination of data availability from different regions, as well as some sort of inherent difficulty with different dialects. The magnitude of the differences is interesting, even if the uncertainty is large. Error rates around Stockholm are on average 20% below the baseline and 25% above it near Umeå.
Expanding the collection
We hope Klang Dialects becomes a standard benchmark for Swedish speech recognition. At around five hours, it is small enough for teams to run evaluations regularly and listen to the errors themselves.
We plan to add more sentences and speakers, recruit in parts of Sweden with fewer contributions, and extend the challenge to more languages. This will help us better understand how speech recognition varies between parts of the country.
We are very grateful to every participant who contributed to this dataset!
Klang Dialects is freely available on Hugging Face. For questions contact Klang.